Automatic testing and rollback of your GitOps with Argo Rollouts
In the previous blog posts in this series (here and here) I’ve taken you through declarative GitOps of Kubernetes clusters with ClusterAPI and Argo CD and how to structure them to run many of clusters with minimal effort.
This blog post picks up where the last one left off — how to test our deployments and to automatically roll them back (or not even cut the traffic over in the first place!) if there are issues.
Argo Rollouts
Rollouts is another project/tool from Argo that is focused on making our deployments more automated and safe. It can do both blue/green as well as canary/progressive deployments — depending on your Ingress setup and type of traffic.
It does this by replacing the built-in Kubernetes Deployment controller with a more advanced one that it provides called a Rollout. That means that it only really helps with workloads that you’d use Deployment for — things that are custom resources, DaemonSets, StatefulSets etc. wouldn’t be good candidates for this treatment.
In our example, we’ll start with blue/green —mainly because the GKE built-in Ingress controller I’m using doesn’t (yet?) support canary. I’ll cover canary in a future post.
Automated Blue/Green Deployments

Here is our example Rollout manifest:
apiVersion: argoproj.io/v1alpha1
kind: Rollout
metadata:
  name: bluegreen-demo
  labels:
    app: bluegreen-demo
spec:
  replicas: 1
  revisionHistoryLimit: 1
  selector:
    matchLabels:
      app: bluegreen-demo
  template:
    metadata:
      labels:
        app: bluegreen-demo
    spec:
      containers:
      - name: bluegreen-demo
        image: argoproj/rollouts-demo:blue
        imagePullPolicy: Always
        ports:
        - name: http
          containerPort: 8080
          protocol: TCP
        resources:
          requests:
            memory: 32Mi
            cpu: 5m
  strategy:
    blueGreen:
      activeService: bluegreen-demo
      previewService: bluegreen-demo-preview
      prePromotionAnalysis:
        templates:
        - templateName: success-rate
        args:
        - name: url_map_name
          value: k8s2-um-1cf9hwd1-default-bluegreen-demo-preview-cn1eress
        - name: project_id
          value: project-435400
      postPromotionAnalysis:
        templates:
        - templateName: success-rate
        args:
        - name: url_map_name
          value: k8s2-um-1cf9hwd1-default-bluegreen-demo-94bd5pw1
        - name: project_id
          value: project-435400
      previewReplicaCount: 1
      autoPromotionEnabled: true
      autoPromotionSeconds: 1
      scaleDownDelaySeconds: 30
      abortScaleDownDelaySeconds: 30
The way that this process works is:
- Beginning at a fully promoted, steady-state, a revision 1 ReplicaSet is pointed to by both the
activeServiceandpreviewService. - A user initiates an update by modifying the pod template (
spec.template.spec). - The revision 2 ReplicaSet is created with size 0.
- The
previewServiceis modified to point to the revision 2 ReplicaSet. TheactiveServiceremains pointing to revision 1. - The revision 2 ReplicaSet is scaled to
previewReplicaCount. - Once revision 2 ReplicaSet Pods are fully available,
prePromotionAnalysisbegins. - Upon success of
prePromotionAnalysis, the blue/green pauses ifautoPromotionEnabledis false - The revision 2 ReplicaSet is scaled to the
spec.replicas - The rollout “promotes” the revision 2 ReplicaSet by updating the
activeServiceto point to it. At this point, there are no services pointing to revision 1 postPromotionAnalysisanalysis begins- Once
postPromotionAnalysiscompletes successfully, the update is successful and the revision 2 ReplicaSet is marked as stable. The rollout is considered fully-promoted. - After waiting
scaleDownDelaySeconds, the revision 1 ReplicaSet is scaled down
The Analysis
There are a variety of ways you can decide if a deployment ‘passes’ or not in the Analysis including:
- Metrics such as the % of failed return codes or latency from services like Prometheus, Datadog, New Relic, AWS CloudWatch, etc.
- A successful Kubernetes Job (which can test nearly anything)
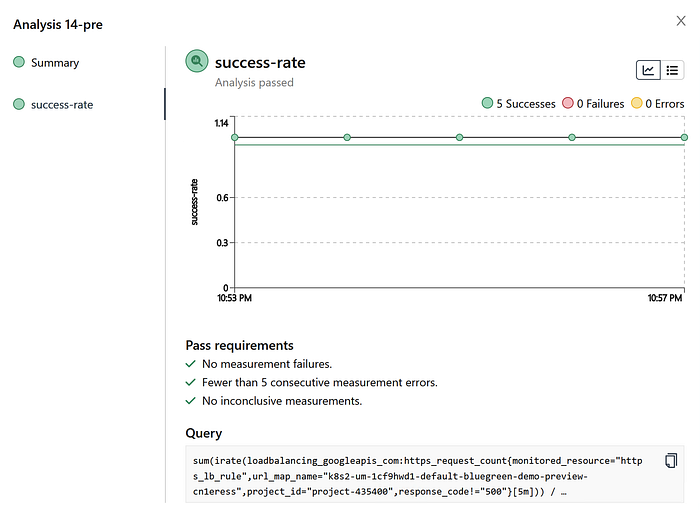
Here is an example of our Prometheus AnalysisTemplate that is checking if the total number of successful requests is greater than or equal to 95% for 5 minutes (for all 5 x 60s runs). You’ll also notice that these can be parameterised with args so that a single AnalysisTemplate can be used by many different Rollouts testing different ingresses.
apiVersion: argoproj.io/v1alpha1
kind: AnalysisTemplate
metadata:
  name: success-rate
spec:
  args:
  - name: url_map_name
  - name: project_id
  metrics:
  - name: success-rate
    interval: 60s
    count: 5
    successCondition: result[0] >= 0.95
    provider:
      prometheus:
        address: http://frontend.default.svc.cluster.local:9090
        query: sum(irate(loadbalancing_googleapis_com:https_request_count{monitored_resource="https_lb_rule",url_map_name="{{args.url_map_name}}",project_id="{{args.project_id}}",response_code!="500"}[5m])) / sum(irate(loadbalancing_googleapis_com:https_request_count{monitored_resource="https_lb_rule",url_map_name="{{args.url_map_name}}",project_id="{{args.project_id}}"}[5m]))
NOTE: In order to get Argo Rollouts to be able to query the GCP Managed Prometheus I had to deploy the frontend service to authenticate to Google via a service account on its behalf as described here. A bash script to set up the service account as well as the frontend manifest are in my example GitHub repo here.
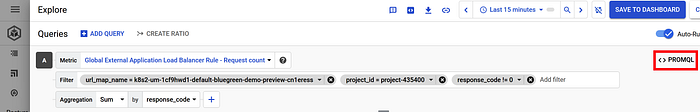
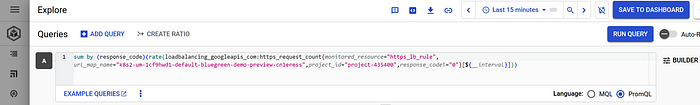
I was pleasantly surprised that the Telemetry tabs on the Ingresses in the GKE console will show you the equivalent PromQL after you click this button (after building the query you want in their arguably easier builder UI) — so this can help you to build the right query to use in the AnalysisTemplate.
Seeing it in action
Argo Rollouts has a great demo web app that lets you see the different ‘colors’ as you flip between blue and green as well as tweak the error rate and latency. We’ll use it here.
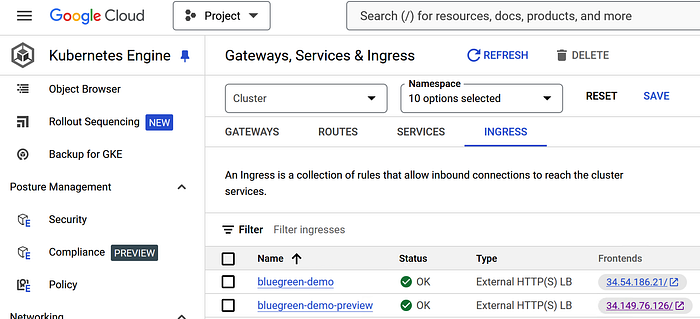
We have our two Ingress endpoints — the current live version (blue) and the preview of the new version (green):
If we use Argo CD to merge in a change of the image tag from argoproj/rollouts-demo:blue to argoproj/rollouts-demo:green in our Rollout manifest that will begin the process. You see the boxes switch from blue to green on the preview ingress endpoint.
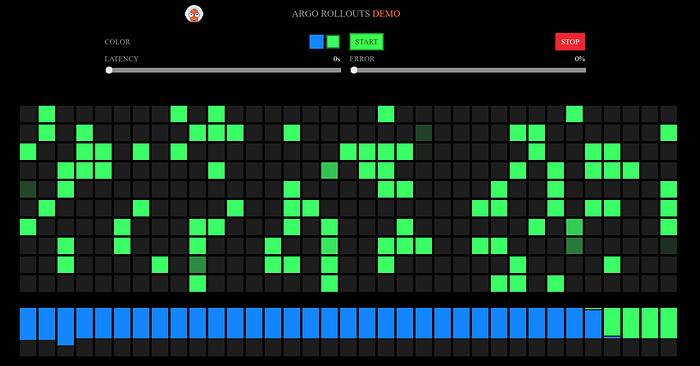
If we leave the ERROR slider under 5% then 5 minutes later you’ll see it flip the other endpoint (the one our customers see) to green too. In this case we left it on 0% and all 5 x 60 second runs had a 1.0 or 100% success rate (i.e. all 200s no 500s in the response codes).
If we had increased it over 5%, though, you’ll see it cancel the rollout and not proceed with flipping the main endpoint.
NOTE: For pre-promotion analysis to be truly effective with blue/green you ideally would send production-like traffic to it. Something like a load or smoke-test. With canary deployments you are instead sending a gradually ramping up proportion of your real production traffic — which, if you can’t easily simulate that, could be better.
And then, once it has flipped the main endpoint, we’ve asked it to do another analysis run. If that sees a greater than 5% error rate in the 5 minutes after the deployment on the main endpoint it’ll automatically roll it back as well.
You can either do pre-deployment analysis, post-deployment analysis or both — as we do here — depending on your needs.
Conclusion
People are often uncomfortable with GitOps, where changes happen as soon as they are pushed/merged to git, and deployments that are fully automated. Argo Rollouts is a great tool that makes that safe while still letting you experience all the benefits of GitOps and modern approaches to managing your Kubernetes apps and clusters.
This is especially important when you are a platform team who needs to manage so many of them!